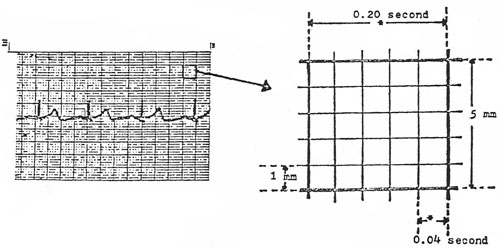
Chapter II: The Electrocardiogram and the Normal EKGPart I: The ECG Paper and the Normal ECG TracingIn order to begin to understand the interpretation of EKC’s one must have an understanding of the EKG paper. Shown in the illustration below are a sample of EKG paper and an enlargement of the markings. The time intervals are shown as well as the measurements of each block on the paper. You will be able to make fairly accurate measurements of the patient’s heart rate and other measurements by counting blocks up and down on the paper. The EKG paper records time sequences (horizontal deflections) and amplitude (vertical deflections) of the electrical activity of the heart. The horizontal lines measure time intervals and heart rate. Each of the small squares equal 0.4 second of time. Five small squares equal 0.20 seconds. Fifteen of the 0.20 squares represent 3 seconds. These 3 – second time intervals are marked on the paper by darker lines as shown below. Conversion table for heart Rate Listed here is a quick guide for determination of heart rate:
Components of Normal Sinus Rhythm
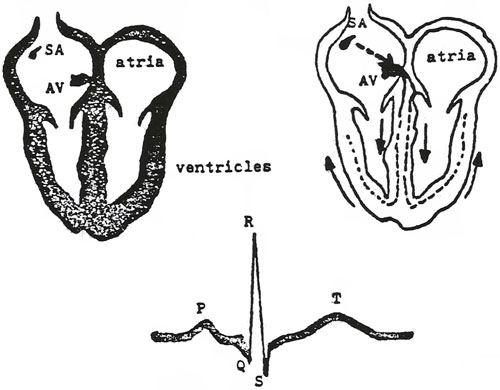
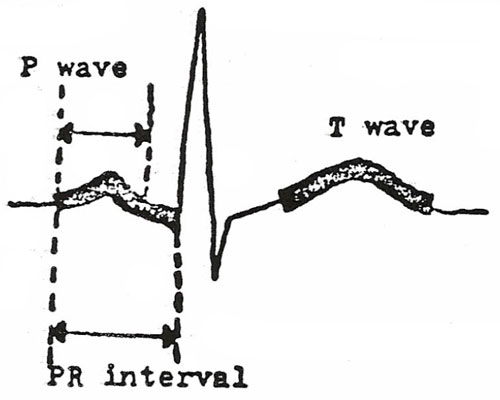
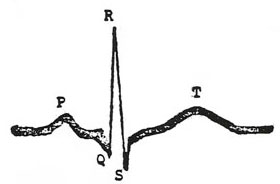
P Wave: The P wave represents depolarization of the right and left atria. Onset of the P Wave is identified as: the first abrupt or gradual deviation from the baseline. The point where the wave returns to the baseline marks the end of the P Wave. A QRS complex normally follows each P Wave. A normal sinus P Wave indicates that the electrical impulse responsible for the P Wave originated in the SA node and that normal depolarization of the right and left atria has occurred.
QRS Complex
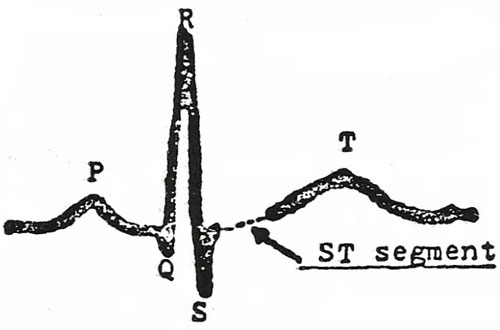
A QRS Complex represents depolarization of the right and left ventricles. The pacemaker site of a normal QRS complex is the SA node or an ectopic pacemaker in the atria of AV junction. (The origin of the QRS is originally from the SA node, and then spreads down through the atria to the AV node, etc.) The onset of the QRS Complex is identified as the point where the first wave of the complex just begin to deviate, abruptly or gradually, from the baseline. This end of the QRS Complex is the pone there the last wave of the complex begin to flatten out, sharply or gradually, at, above, or below the baseline. This point the junction between the QRS complex and the S-T segment is called the “JUNCTION” or “J POINT.” A normal QRS Complex indicates that the electrical impulse has progressed normally from the bundle of HIS to the Purkinje network through the right and left bundle branches, and that normal depolarization of the right and left ventricles has occurred. Of course, there can be several “normal” variations of the QRS Complex. These will be discussed later in the course.
T Wave
A T Wave represents ventricular repolarization. Repolarization of the ventricles begins at the epicardial surface of the ventricles and progresses inwardly through the ventricular walls to the endocardial surface. The T Wave occurs during the last part of the ventricular systole. The onset of the T Wave is the first or abrupt or gradual deviation from the S-T segment; or from the point where the slope of the S-T segment appears to become abruptly of gradually steeper. If the S-T segment is absent, the T Wave begins at the end of the QRS Complete (or the J Point). The point where the T Wave returns to the baseline marks the end of the T Wave. Often the onset and end of the T Wave are difficult to determine with certainty.
The U Wave The U Wave probably represents the final state of repolarization of the ventricles. The U Wave probably represents repolarization of a small segment of the ventricles, such as the papillary muscles or ventricular septum, after most of the right and left ventricles have been repolarized. Although uncommon, and not easily identified, the U Wave can best be seen when the heart rate is slow. A U Wave indicates that the repolarization of the ventricles has occurred. An abnormally tall U wave may be present in hypokalemia, cardiomyopathy, left ventricle hypertrophy, diabetes, and may follow administration of digitalis and quinidine.
The Normal ECG Tracing
The EKG Leads The 12-lead EKG will be discussed in greater detail later in this course. However, at this time we will present an introduction to the EKG leads simply to help explain the basics of EKG interpretation that will follow. Later, the specifics of leads and lead placement will be discussed. An EKG lead consists of two surface electrodes of opposite polarity (positive and negative) or one positive surface electrode and one reference point. A lead composed of two electrodes of opposite polarity is called a Bipolar Lead. A lead composed of a single positive electrode and a reference point is called a Unipolar Lead. All leads of the ECG record the same electrical impulses of the heart muscle. However, each lead placed in a different area of the body, records the electrical activity from a slightly different “angle.” This means that by using the ECG tracing from different positions of the chest, various ECG waves will be accentuated. Diagnosis of arrhythmias may be made easier by examination of different leads. The 12-lead ECG tracing is standard. Six leads are recorded by placing wires on each limb. The other six leads are recorded by placing wires on the chest in six specific positions. Limb Leads: I, II, III, IV, V, VI
Chest Leads: For diagnosis of most arrhythmias, lead II is most commonly used. Lead II (and the chest leads) most consistently show the most clear P Wave which can be diagnostic of many common arrhythmias. The following leads are listed and their relationship to areas of the heart muscle:
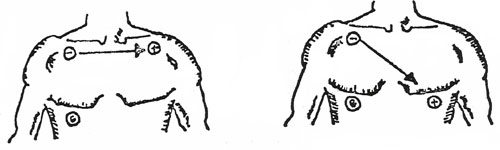
If changes in the ECG tracing are seen in a group of the above leads, the disease can be localized to a particular area of the heart. In the case of an MI which show changes in the leads ADD and AVR only, the damage to the heart is in the right side. If the MD can thus localize the damage to the heart they can also diagnose other possible problems in the heart. Valvular problems may show up as a specific change in one or more leads of the ECG tracing. Blockages in one of the major arteries of veins may also show up as an altered deflection in the ECG. Below is a diagram of the chest and the placement of leads of the chest so as to trace leads I and II. When the patient is being monitored for a specific arrhythmia, it will help to connect the wires to the spot of the chest that will show that arrhythmia most clearly.
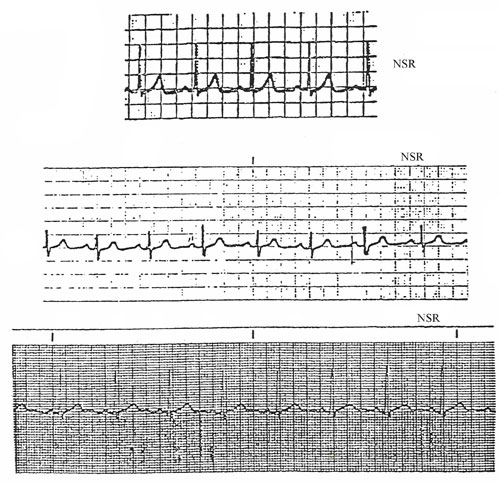
G = Ground Point (Reference Point) Normal Sinus Rhythm Normal Sinus Rhythm, NSR, is the term used to describe the normal heartbeat. Looking at the EKG tracing, all beats appear similar and are evenly spaced. The NSR implies that all of the beats have a normal pacemaker (starts at the SA node). All of the beats also follow the normal conduction pathways in NSR. Lastly, all components of the waves are similar, the P Wave, QRS Complex, and T Wavers are similar to each other.
Next: Arrhythmias |
||||||||||||||||||||||||||||||||||||||||||||||||